











A rising dollar value of open interest combines changes in outstanding positions with changes in price. A dated Bitcoin case study separates the two and tests what the evidence can support.
When Bitcoin price and open interest rise together, the move is often described as fresh money entering the market. The dollar counter, however, can increase even without new contracts. Positive funding is no guarantee of further gains either. Bitcoin derivatives analysis starts by asking which claim each measurement can actually support.
Our case study covers the Binance USDⓈ-M BTCUSDT perpetual contract from October 15, 2026 at 00:00 UTC to October 22 at 00:00 UTC. We compare daily observations and keep unresolved questions separate. The Bitcoin price page carries subsequent market updates; the figures below remain a fixed historical sample.
Three measurements, three different changes
Open interest is the stock of outstanding contracts. Reporting its BTC amount alongside its USDT value helps distinguish quantity from valuation. The price column uses the daily candle that finished immediately before each midnight OI observation, rather than a candle still in progress.
| Measurement | October 15 | October 22 | Change |
|---|---|---|---|
| Open interest, BTC | 93,117.263 | 98,001.941 | +5.25% |
| Open interest, USDT | 7.602 billion | 8.237 billion | +8.35% |
| Previous daily candle close, USDT | 81,641.50 | 84,050.00 | +2.95% |
The stock grew by approximately 4,884.678 BTC, while its reported USDT value increased by about 634.82 million. That 634.82 million USDT is not a measurement of newly deposited collateral. Notional exposure and the margin supporting it are different quantities. Dollar valuation also incorporates price movements; a valuation price need not match the latest traded price at every instant.
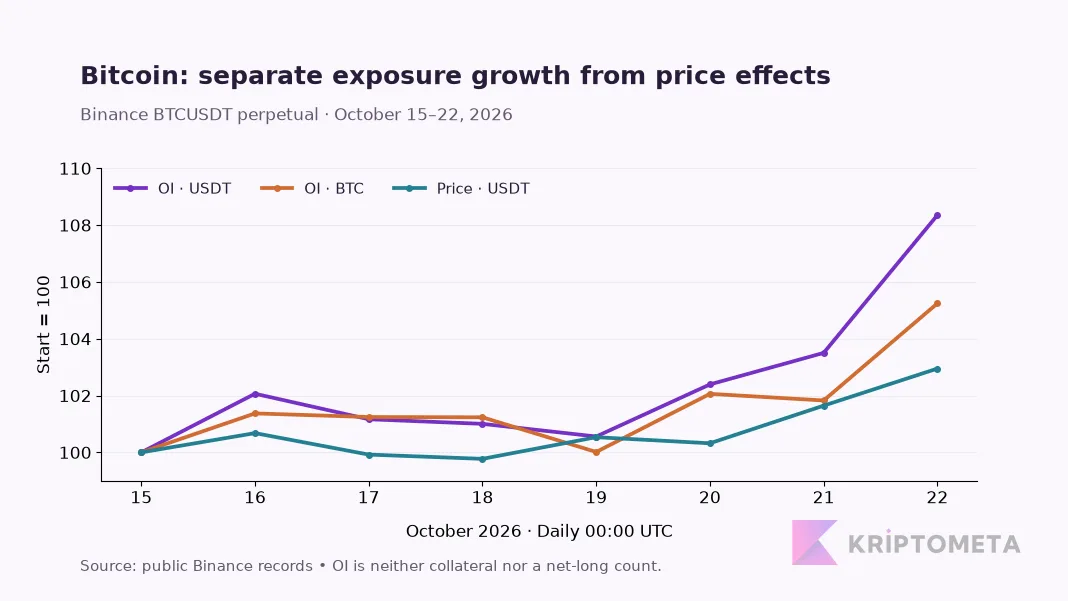
Daily observations indexed to 100 at the start. USDT open interest also reflects valuation changes. KriptoMeta chart using public exchange records.
On October 19, the BTC-denominated stock was close to its starting level even though price remained higher. In the final daily step, October 21–22, BTC open interest grew about 3.36% and price rose 1.28%. A single weekly percentage hides when exposure accelerated. Eight daily snapshots still cannot reconstruct intraday openings and closures.
Positive funding: demand or an expensive position?
A funding rate determines periodic payments between perpetual-contract holders. All 21 settled rates after the opening boundary and through the closing boundary were positive, summing to 0.128282%. Long positions paid to carry exposure. The figures do not reveal how many traders expected a rise or the leverage each account used.
A hypothetical long maintained at exactly 10,000 USDT of notional at every settlement would incur approximately 12.83 USDT in funding. That is not the return of an actual fixed-BTC position: its notional would move with price. Trading fees, slippage and the cost of maintaining constant exposure are excluded.
The final settled rate, at October 22 00:00 UTC, was approximately 0.000507%, below the 0.01% seen at some earlier settlements. A positive weekly total therefore does not demonstrate that funding was becoming more expensive at the endpoint. Estimates for later settlements are not added to the historical calculation.
Where observation ends and interpretation begins
Observed: outstanding BTC exposure expanded, price rose and funding remained positive within the selected window. Not observed: participants' collateral, their leverage distribution, hedges on other venues or the source of spot buying.
Every new contract has a counterparty. Rising OI cannot mean that there are more long contracts than short contracts. A spot Bitcoin holder may open a futures short to reduce directional risk. The same outstanding-contract stock can contain both speculation and hedging.
Average account leverage cannot be recovered from aggregate OI. Readers examining account-level risk can use the leverage and liquidation calculator with hypothetical inputs. Its result does not replace a venue's maintenance-margin tiers, fees or cross-margin rules.
What would distinguish the next three scenarios?
| Scenario | Supporting observation | Evidence against it |
|---|---|---|
| Exposure grows alongside price | BTC-denominated OI and price advance together; funding stays within its usual historical distribution. | Price stalls or falls while OI and funding accelerate. |
| Directional positions become crowded | OI grows without price progress and funding becomes noticeably more expensive across several settlements. | Funding normalizes, price catches up or outstanding exposure contracts. |
| Outstanding exposure unwinds | Price and BTC-denominated OI fall; matching realized liquidation records strengthen a forced-closure explanation. | Only USDT valuation falls while BTC exposure remains stable, or there is no supporting closure evidence. |
These patterns are not buy or sell instructions. A universal danger threshold for funding would be misleading; the same contract needs a longer historical baseline. One week is insufficient to establish an extreme-value threshold.
What liquidation records add
Falling price alongside falling OI establishes that outstanding exposure has decreased. It does not establish that every position closed through liquidation. Voluntary exits also reduce OI. A forced-closure claim needs realized liquidation records matched by exchange, time window and reporting methodology.
Bright areas on a liquidation heatmap are model estimates of potential concentration, rather than a ledger of losses already realized. Their presence does not prove that price will visit those levels. Adding heatmap estimates to realized liquidations combines fundamentally different data types.
How far can one contract represent the market?
The sample excludes coin-margined contracts, other exchanges, dated futures and options. An aggregated Bitcoin OI total from a provider such as CoinGlass should not be expected to equal this single-contract figure. Match product coverage and venue first, then units and timestamps.
Institutional spot demand is a separate question addressed in our spot Bitcoin ETF flows analysis. Dollar conditions are examined in the dollar–Bitcoin relationship. Calling derivatives growth a rise in macro liquidity would skip the evidence needed to connect them.
The CoinGlass review examines aggregate filters and estimated-map limitations separately. Choosing a data platform and interpreting a dated market sample are different tasks.
Method and conditions for updating the analysis
Public Binance records were retrieved on October 22, 2026. The eight OI observations represent daily 00:00 UTC boundaries. Each price comes from the candle completed just before that boundary. The funding calculation excludes the starting payment and includes the ending payment; a one-second tolerance handles millisecond offsets in exchange settlement timestamps. Percentage changes use unrounded source values.
Field definitions are documented in the Binance market-data documentation. A later edition should refresh price, BTC-denominated OI and settled funding together. Changing only the latest price would leave an old exposure argument looking current. The narrow conclusion supported here is an expansion in outstanding contracts. Excessive leverage and a certain future direction remain unproven.