




















A green number on a calendar is not necessarily good news for crypto. Separate the reporting period, forecast surprise and revisions before interpreting a release.
To read an economic calendar for crypto, identify what the release measures before comparing the actual result with the forecast. Then check the previous reading and any revision. Reversing that order can lead to an easy mistake: inflation may be lower than last month but still higher than expected. Work from the series name, period, unit and comparison basis, rather than the color displayed by the calendar.
What do the main indicators measure?
The US Consumer Price Index, or CPI, tracks consumer price changes. A monthly change and an annual change answer different questions. Headline measures and core measures excluding food and energy are not interchangeable either. Read the complete series label rather than stopping at “inflation.”
The PCE price index measures consumer expenditure prices with different coverage and methodology. Different CPI and PCE readings for the same month are not automatically an error. Payroll growth, unemployment and wage changes describe other aspects of the economy. A statement that employment was “strong” remains incomplete until the underlying series is identified.
A policy-rate target range is neither an inflation reading nor a bond yield. Listing an FOMC decision beside CPI and PCE releases does not turn them into the same kind of information. Writing down the question answered by each row prevents unlike measures from being treated as substitutes.
Compare actual, forecast and previous readings separately
The actual reading is the result published by the relevant statistical agency. A forecast normally comes from estimates compiled by the calendar provider; it is not an official release result. The previous reading belongs to an earlier reporting period and may have been revised. Two services collecting forecasts can display different consensus figures.
| Field | Value | Interpretation |
|---|---|---|
| Previous month | 0.4% | The earlier monthly change in the same series. |
| Forecast | 0.2% | An estimate recorded before the announcement. |
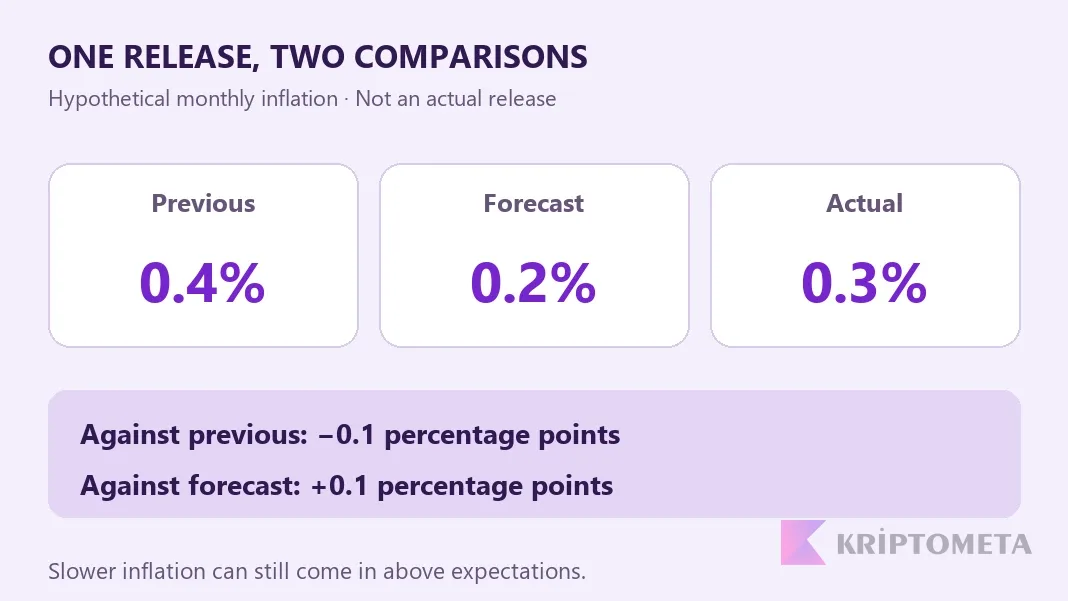
| Actual | 0.3% | 0.1 percentage points below the previous reading, but 0.1 points above the forecast. |
Price growth slowed relative to the previous month, but not as much as expected. “Inflation eased” and “inflation beat the forecast” can therefore both describe this example. The figures are invented for instruction, not taken from a particular release or offered as a trading signal.
Keep monthly, annual and seasonal adjustments distinct
A monthly rate compares consecutive months; a year-over-year rate compares the same month across two years. The annual rate can fall partly because a month with a large earlier increase drops out of the comparison. That does not mean prices fell in the latest month.
Seasonal adjustment aims to remove regularly recurring seasonal effects. Do not calculate a surprise by pairing a seasonally adjusted monthly observation with an unrelated unadjusted series. Keep monthly or annual frequency, headline or core coverage, and adjustment status together in the data record.
Recalculate the comparison when previous data change
The BLS revises initial nonfarm payroll estimates as more information arrives in subsequent months. A change in the calendar's previous column is not necessarily a provider mistake. Keeping the first release and the revised value separately makes the change traceable.
Suppose last month's initial employment gain was 200,000, its revised gain is 150,000, and the new month's gain is 180,000. The new figure is 20,000 below the old initial estimate but 30,000 above the revised estimate. Even the direction of the comparison changes. These are hypothetical figures; the lesson is to use the same series and the intended data vintage.
Check the release source and time zone
Confirm the time zone selected in the calendar. The publishing agency's local time, UTC and your own local time may differ. Daylight-saving transitions make a permanently memorized offset unreliable. An “ET” label does not represent the same UTC offset throughout the year.
Keep the official bulletin link, reference period, release time and access time with your reading notes. A screenshot shared online may refer to an earlier month. Open the source and check the period heading before trusting the calendar label alone.
How should the release be connected to a crypto chart?
Record the data surprise separately from the market response. “Inflation was above the forecast” is an observation; “rate cuts may be delayed” is an interpretation. Bitcoin falling in the same minute does not prove that interpretation caused the decline. Other news and position closures may overlap with the release.
A correlation comparison needs matching periods and comparable series. Higher volatility can make the first move particularly misleading as a guide to lasting direction. Rather than freezing a live price inside an educational article, use the chart on the Bitcoin price page to inspect the chosen window.
Scan the latest crypto news around the release time and note simultaneous exchange, network or regulatory events separately. Publication time and event time need not be identical.
Our short note format is: release → forecast difference → revision → possible explanation → evidence that could overturn the explanation. Filling in the last field makes it harder to select only observations that support an initial view. Reading a calendar cannot guarantee a price forecast; it can reduce avoidable comparison errors.
Moving from a data surprise to crypto demand also requires a proposed mechanism. Our Fed rates and crypto analysis separates funding, real returns and risk appetite through three conditional scenarios.

