












DeFi sector analysis starts by asking where a rising revenue total comes from. Trading and lending can move in different directions, while a busier protocol keeps a smaller share.
At KriptoMeta, we examine how activity translates into economic value, who receives it and how widely growth is spread. Double-counted revenue or mismatched reporting periods can overturn an apparently strong growth case.
The framework uses protocol documentation checked on 12 October 2026. The figures below are hypothetical tests of the method, not current sector totals or reported Aave and Uniswap results. Equal-length periods let us separate changes in activity from changes in the share retained.
Identify the revenue line before comparing it
User fees, liquidity provider earnings and protocol revenue are different measures. Under DeFiLlama’s definitions, Revenue excludes the LP share, while Holders Revenue is a subset distributed to holders. Adding those two lines would count part of the same revenue twice.
Matching column titles are not enough. If one dataset reports everything users paid and another reports only the treasury allocation, the ranking starts from incompatible inputs. Financing from a token sale and gains on treasury assets also answer different questions from revenue earned through a service.
Trading and lending have different economic engines
For a DEX, examine swap volume, fees per trade and the allocation of those fees. Uniswap’s fee documentation separates LP and protocol shares, with differences across versions and pools. Applying a single rate to all Uniswap volume would give a misleading protocol-revenue estimate. Our UNI analysis covers the separate mechanism for token value accrual.
For lending, examine outstanding borrowing, borrower interest and the protocol allocation. The reserve factor in Aave’s explanation assigns part of borrower interest to the treasury. Applying that factor to all deposits instead measures the wrong base. The reserve-level mechanism is covered in our Aave analysis; the sector comparison needs compatible revenue definitions.
| Check | DEX | Lending protocol |
|---|---|---|
| Activity measure | Swaps during the period | Borrowing outstanding through the period |
| Income source | Allocation from swap fees | Allocation from borrower interest |
| Misleading growth signal | More volume at a lower average fee | More borrowing at a lower rate or protocol share |
| Additional check | Versions, pools and incentives | Reserves, collateral and uncollectible debt |
Swap volume is a flow; outstanding borrowing is a balance at a point in time. Saying $10 billion of swaps is twice $5 billion of borrowing describes the numbers but does not compare economic performance. Compare the revenue generated by each activity over matching dates instead.
Why fee growth may leave the protocol with less
Take a hypothetical sample containing a DEX and a lending protocol. Both are measured across the same two 30-day windows. The table shows the allocation to the protocol side before operating expenses.
| Measure | First period | Second period |
|---|---|---|
| DEX: user fees | 6.00 | 9.00 |
| DEX: protocol revenue | 0.90 | 0.90 |
| Lending: borrower interest | 4.00 | 5.00 |
| Lending: protocol revenue | 0.40 | 0.50 |
| Sample: total user payments | 10.00 | 14.00 |
| Sample: total protocol revenue | 1.30 | 1.40 |
User payments rise 40%, yet protocol revenue grows only about 7.7%. The DEX revenue-to-fee ratio falls from 15% to 10%; the lending ratio stays at 10%. For the combined sample, 1.30 / 10 is 13%, compared with 1.40 / 14, or 10%, in the second period. Divide total revenue by total payments rather than taking an unweighted average of the two ratios.
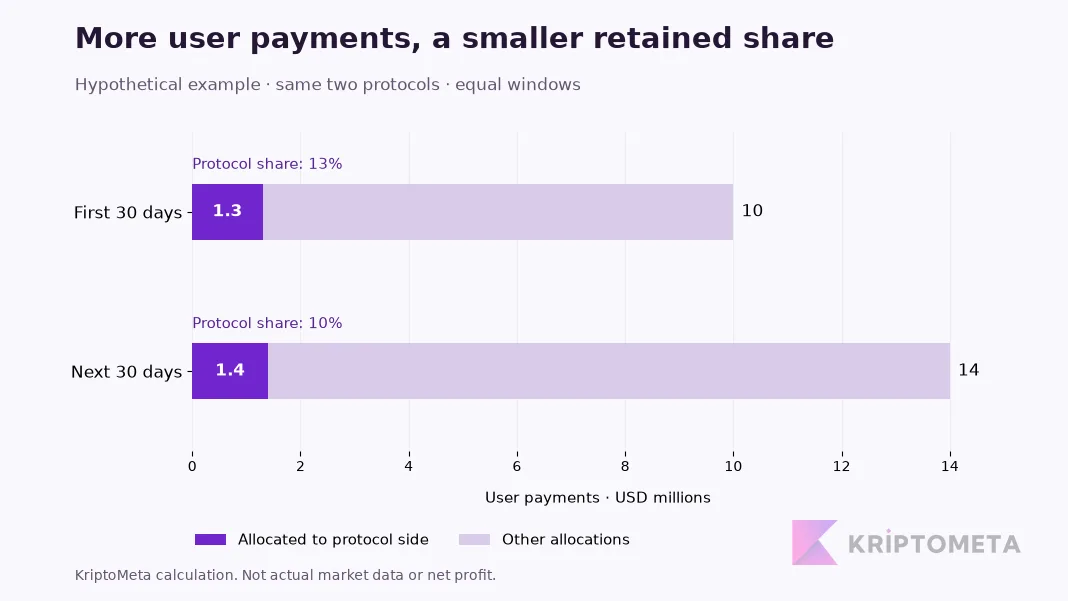
KriptoMeta’s hypothetical example compares protocol-side allocations. It does not show net profit or an investment return.
The DEX ratio could fall without a rule change if trading shifts toward pools with lower effective protocol allocations. Alternatively, governance may have changed the share retained for the same service. We cannot infer stronger demand or a deteriorating product until we distinguish those explanations. Pool mix and allocation rules are the first checks.
Revenue quality includes repeat demand, costs and risk
Activity that disappears with an incentive campaign differs from recurring demand. Suppose comparable operating expenses in our example rise from $0.80 million to $1.10 million. Revenue less those expenses falls from $0.50 million to $0.30 million. Revenue grew, but the simplified remainder contracted by 40%. Without complete accounting, other costs and liabilities, that remainder is not net profit.
For token incentives, record both the number distributed and their dollar value using a consistent valuation method. Payment in a protocol’s own token is not costless simply because no dollars leave a bank account. A rising token price can increase the measured subsidy without increasing the number of recipients.
A jump in lending income alongside collateral losses needs particular scrutiny. Uncollectible debt can change what accumulated revenue is available to fund. For a DEX, policies that persistently squeeze LP compensation may weaken liquidity. A higher protocol share is not automatically a stronger business.
How many products are actually growing?
Growth breadth is the next test. In a separate hypothetical example, revenue across the same five protocols rises from $10 million to $12 million. The largest protocol grows from $4 million to $7 million while the other four fall from $6 million to $5 million combined. The headline is 20% growth; the group outside the leader shrinks roughly 16.7%. The leader’s share rises from 40% to about 58.3%.
Alongside the total, track growth for a fixed set of protocols, the median change and the share captured by the largest products. If a dataset adds a chain or protocol, distinguish wider coverage from greater activity. Our DeFiLlama review explains how to inspect the scope behind a dashboard.
Keep a comparison another reader can reproduce
- Fix the scope: protocol list, versions, chains and UTC start/end boundaries.
- Record the definitions: which user fees, LP allocations, protocol revenues and holder distributions are included?
- Match the windows: do not compare a partial day with a completed day, or a 30-day amount with an annualized estimate.
- Separate missing observations: unavailable is not zero. Leave the possible effect of missing protocols explicit.
- Preserve the evidence: query or export date, methodology link and subsequent revisions.
Accrual also differs from immediately available cash. Aave V3’s mintToTreasury documentation describes minting the accrued reserve-factor share as aTokens. Before treating a recognized claim as spendable cash, check the asset received and its availability.
What would change our assessment?
Several comparable periods of rising revenue, wider participation in that growth and controlled expenses support a stronger economic case. An increase concentrated in one product, temporary incentives or an allocation change gives weaker evidence of durable demand. Missing expense data leaves profitability unresolved.
How a treasury uses its allocation is a governance question beyond the revenue counter. Our DAO decision-power analysis distinguishes a vote from authority to execute a budget. Revenue analysis tests the possibility of value creation; it does not by itself establish a reason to buy a token.